Introduction
Data & Insights' Capital Projects Explorer allows you to visualize the projects that make up your CIP portfolio in a simple, user-friendly interface. The Capital Projects Explorer interface is automatically generated from your data.
Capital Projects Explorer is flexible to your organization’s specific portfolio and needs. The table below shows what data is needed to visualize your portfolio.
|
Dashboard Component |
Dataset(s) to Enable Feature |
|
Project Details |
|
|
Project Map Shapes |
|
|
Agency District Map Shapes |
For your Capital Projects Explorer to work, each dataset must be organized into a flat-file. You can think of this as having all your data on a single tab in Microsoft Excel. This document will explain each of these datasets in detail.
Project Details Dataset
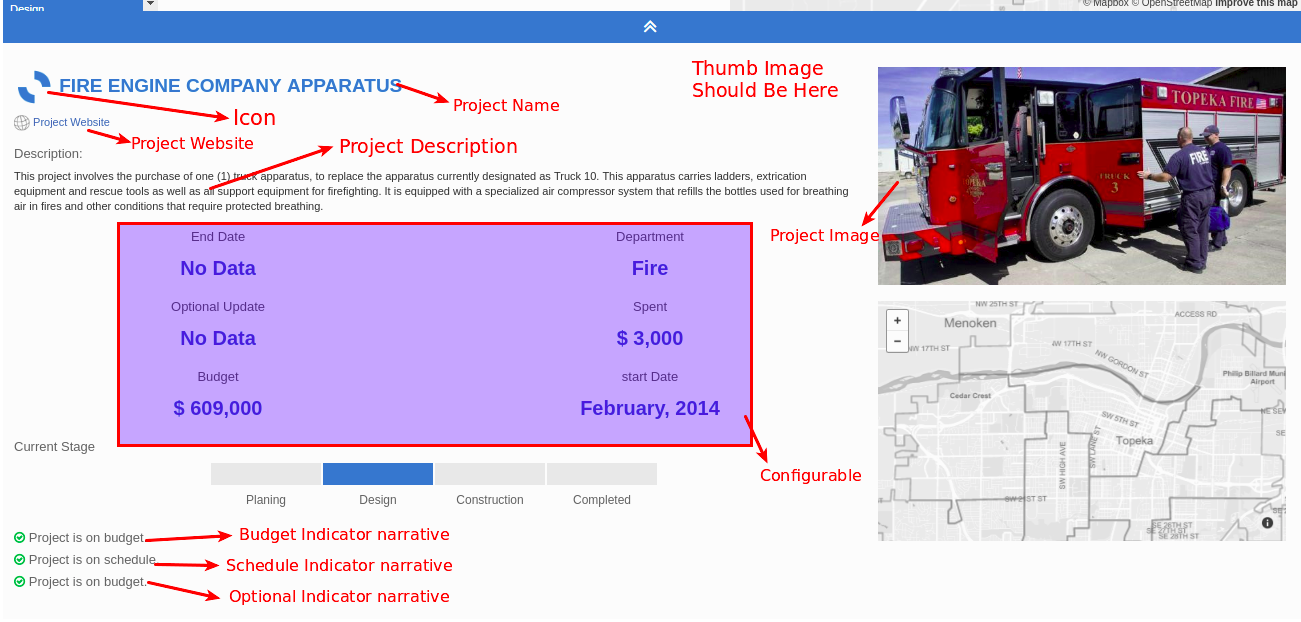
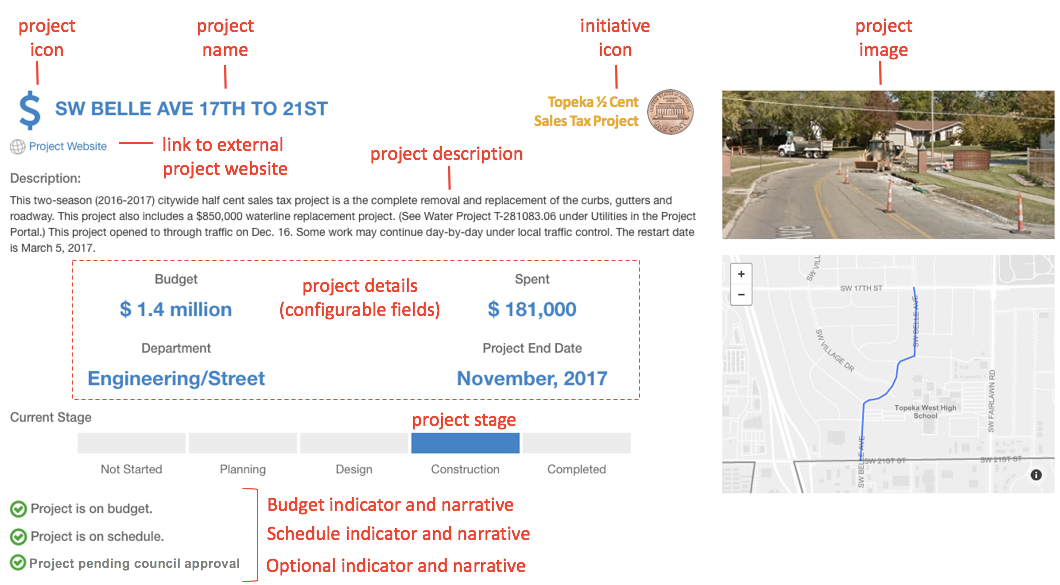
The Project Details dataset contains all the descriptive information about your capital projects. The values in this dataset populate the module’s filters as well as the project details page. This dataset must be organized into a flat-file. You can think of this as having all your data on a single tab in Microsoft Excel.
|
Recommended Column Name |
Type |
Value |
Notes |
|
project_id |
Required |
Text |
The ID for a project. Used to join together the project details and project shapes datasets. |
|
project_name |
Required |
Text |
The name of the project. |
|
Project Filters |
|||
|
category_id |
Required |
Text |
The ID of the category that the project is associated with. (e.g. Planning, Design, Construction) |
|
subcategory_id |
Optional |
Text |
The ID of the subcategory that the project is associated with. (eg. Parks, Schools) |
|
district_id |
Required |
Text |
The ID of the district that the project falls within. Can be a comma-separated array for a project that falls in multiple districts. |
|
project_stage_id |
Required |
Text |
The ID for the stage the project is in. |
|
Project Details - Description |
|||
|
project_image |
Recommended |
Text (URL) |
Link to a hosted image that shows up for a project in the project details pane. |
|
project_description |
Recommended |
Text |
The text description of a project that appears in the project details pane. |
|
project_detail (1-n) |
Optional |
Text |
Any number of additional project detail columns may be added to the project details pane (eg, department, fund, etc) |
|
project_start_date |
Recommended |
Date/Time |
The estimated start date of a project. Shows up as Month, Year. |
|
project_end_date |
Recommended |
Date/Time |
The end date of a project. Shows up as Month, Year. |
|
website |
Recommended |
Text (URL) |
Link to an external website for the project. Shows up in the project details pane. |
|
icon |
Recommended |
Text |
The key to the icon for the project. Default is to show the icon associated with its category. The link to a hosted initiative icon is configured in the administration panel. |
|
Initiative icon |
Optional |
Text |
The key to the initiative icon for a project - typically, used to indicate if the project is part of a bond measure or other voter-approved levy. The link to a hosted initiative icon is configured in the administration panel. |
|
Project Details - Budget |
|||
|
budget |
Recommended |
Number |
The budgeted amount for the project. |
|
budget_range |
Optional |
Number |
The range of the budget used for the project. When a project has a budget_range, that value will show appended to budget (eg $ [budget] - $ [budget_range]). Used when a project still has uncertainty about cost/scope. |
|
amount_spent |
Optional |
Number |
The amount spent on the project. |
|
budget_indicator |
Recommended |
Text |
The flag for whether the project schedule is red, yellow or green. |
|
budget_indicator_narrative |
Recommended |
Text |
The description associated with the project’s budget status. |
|
budget_text |
Optional |
Text |
The longer description of the text associated with the project’s budget status. |
|
Project Details - Status |
|||
|
schedule_indicator |
Recommended |
Text |
The flag for whether the project schedule is red, yellow or green. |
|
schedule_indicator_narrative |
Recommended |
Text |
The description associated with the project’s schedule status. |
|
optional_indicator_narrative |
Recommended |
Text |
An optional 3rd indicator narrative if projects are being evaluated in ways besides status and budget. |
|
schedule_text |
Optional |
Text |
|
Project Shapes Dataset
Capital Projects Explorer expects the shapes for projects to be in a separate dataset than the details of those projects.
|
Recommended Column Name |
Type |
Value |
Notes |
|
project_id |
Required |
Text |
The key used to join shapes with projects. |
|
project_name |
Optional |
Text |
The name of the project. |
|
the_geom |
Required |
(multi) line, point or polygon |
The geometry column that contains the project shapes. |
Agency Shapes Dataset
Capital Projects Explorer expects projects to be filtered by districts or regions and offers a clickable map of those districts to make navigation more straightforward.
|
Recommended Column Name |
Type |
Value |
Notes |
|
district_id |
Required |
Text |
The key used to join shapes with districts. |
|
project_name |
Optional |
Text |
The name of the project. |
|
the_geom |
Required |
Multipolygon |
The multipolygon column that contains the district shapes. |
Comments
Article is closed for comments.