Overview: Power BI is a Microsoft tool for creating visualizations, reports, and dashboards.
Example
To open your data and manipulate it using Power BI, you’ll want to first find the OData endpoint for the dataset. Instructions for locating this endpoint can be found in this support article.
Now that you have your endpoint, you’re ready to open up Power BI and get started!
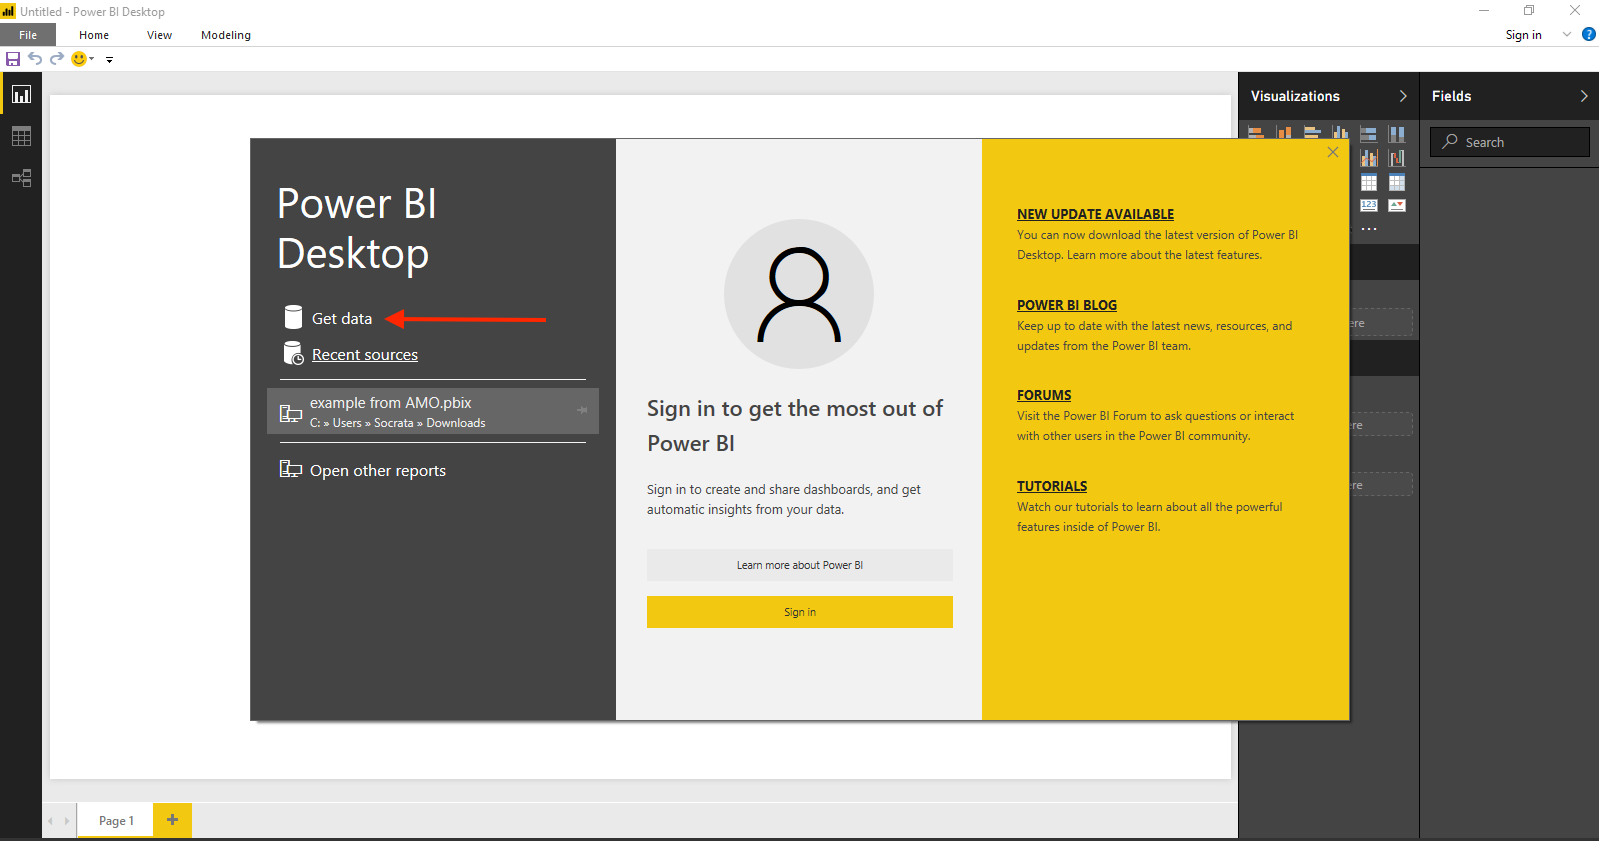
Upon opening, you should see a page with several options on the left-hand side. Click on Get data to open a dialogue box with many data source options.
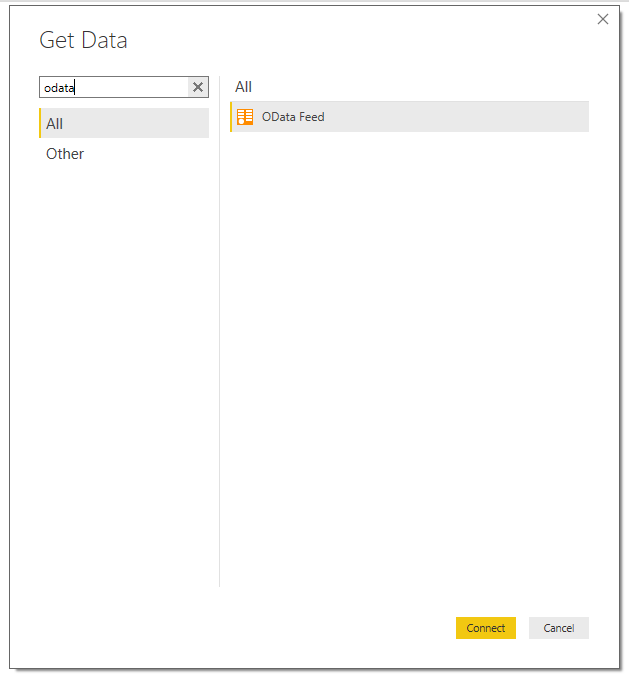
Search for “OData” to bring up the OData Feed option, then double-click the option or click Connect.
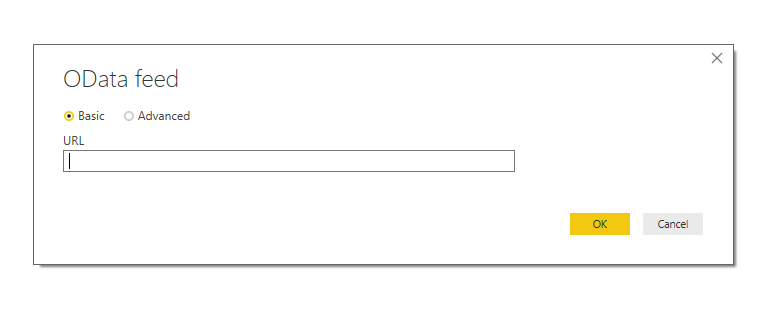
This will open up the OData feed connection dialogue box. If your dataset is public, simply input the OData endpoint in the URL field and click OK. If your dataset is private, clicking OK will open up an Authentication tab where you can input your Data & Insights credentials to gain access to the dataset.
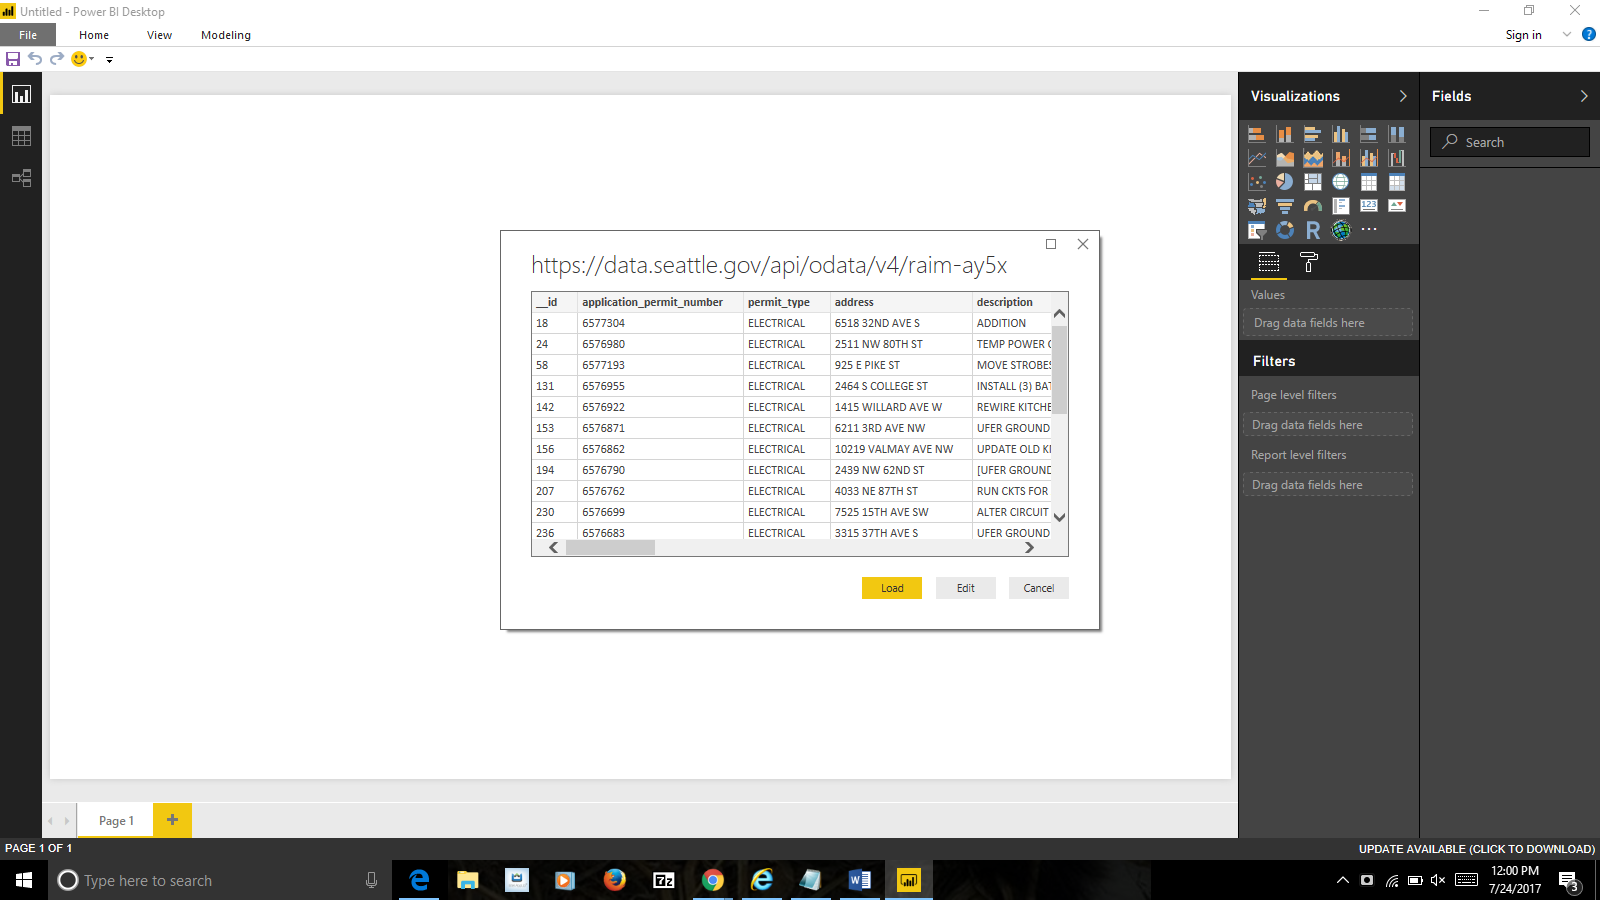
Once you connect your data, you will see a preview of the dataset. Click Load to open the dataset in Power BI.
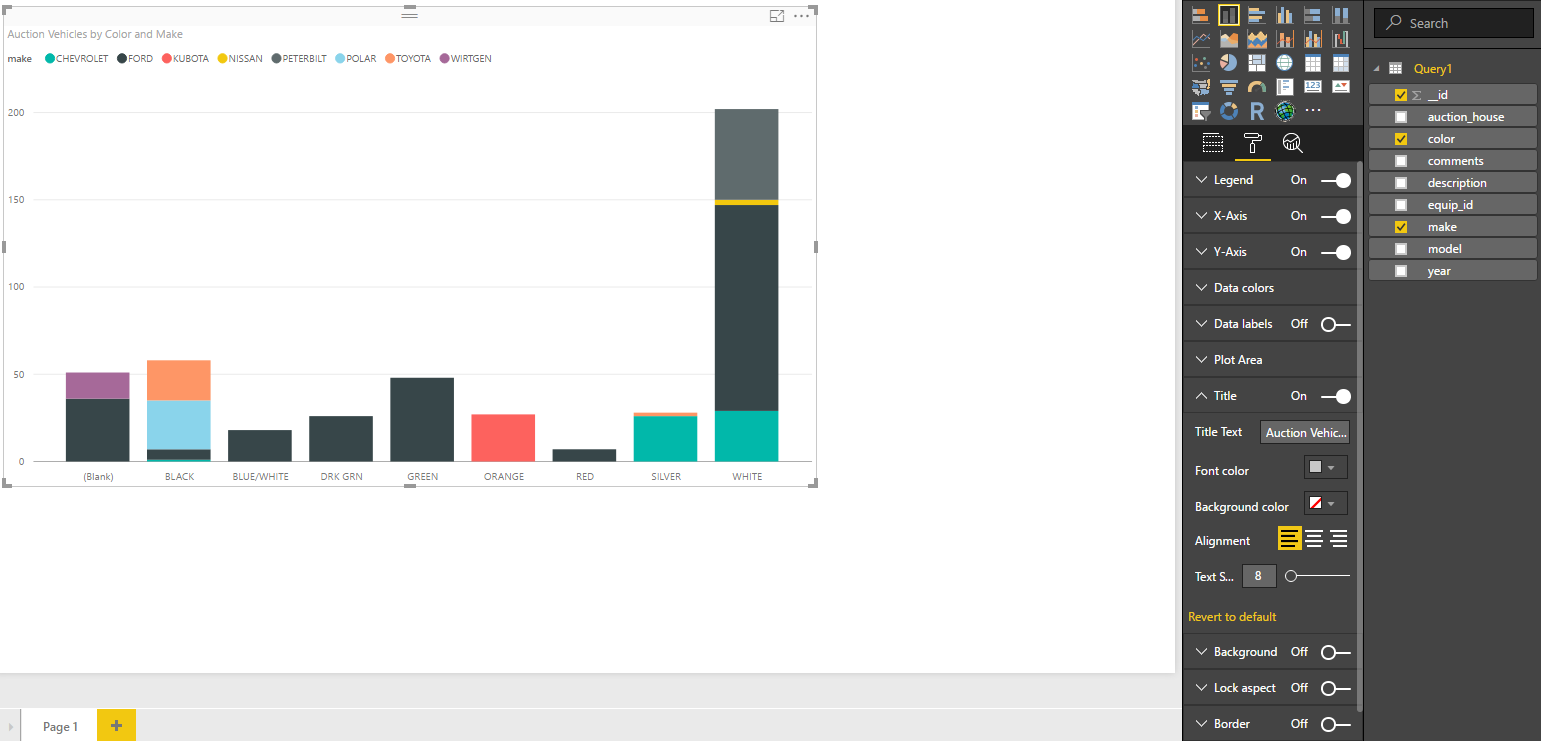
From there, you can select fields to include in visualizations, tables, and maps. Below, see an example of a visualization built off of a Seattle Fleet Auction dataset, breaking down the available vehicles by color and vehicle make.
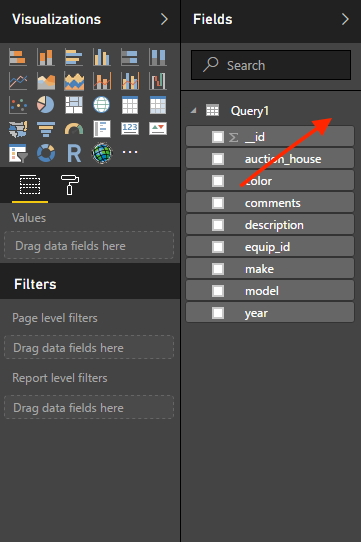
To refresh your data in Power BI, click on the menu next to your Query in the right-hand panel (see the below screenshot for an example). Then, click on Refresh data and the OData connection will be refreshed, along with your data in Power BI!
For more Power BI tips and documentation, see this site.
Comments
Article is closed for comments.