Charts and Maps created through the Visualization Canvas can be embedded onto other sites through either a Javascript of iFrame embed.
60-second video here: How to Embed a Visualization in a Web Page.
Embedding Visualizations
1.) Navigate to the chart or map that you would like to embed.
2.) While on the chart, click the share icon to view the embed options.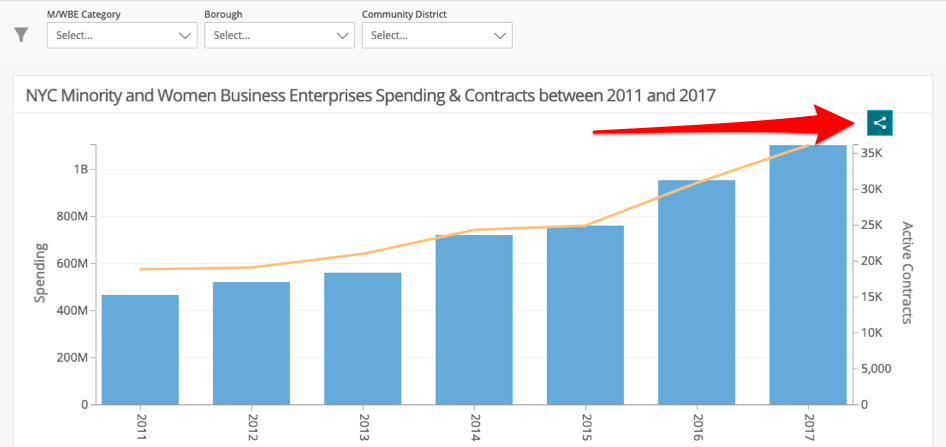
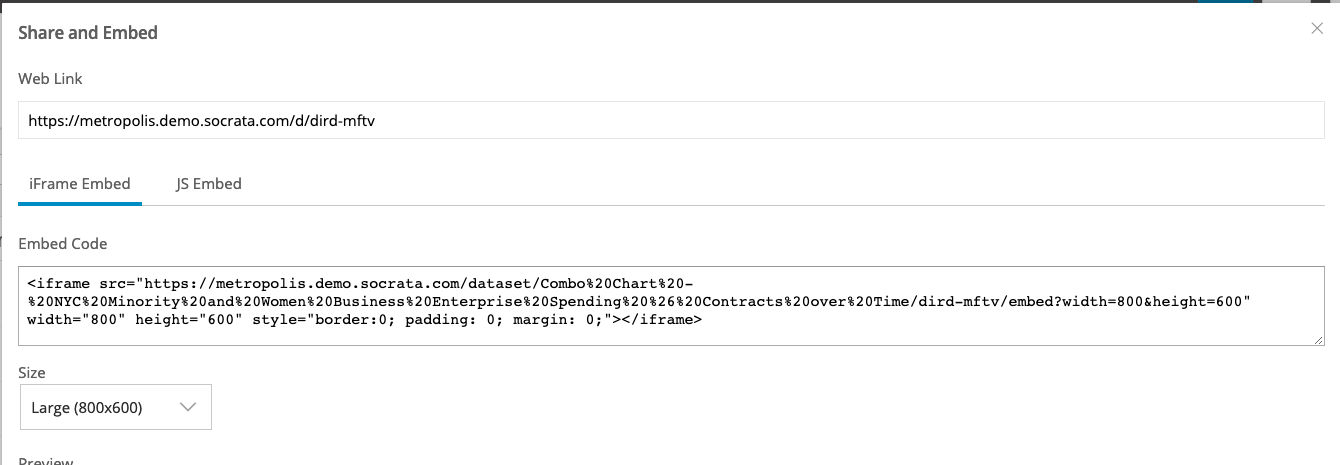
3.) This will open up a window that contains all the information you need to embed your dataset. You will be given two code options: iFrame and JS. You can simply choose your code option and size and this will automatically generate your code.
4.) Now that you have your embed code, you can add your visualization directly into your webpage!
Difference between using a JS embed vs using an iFrame embed
JS embeds are a static embed of the visualization at the point in time you embed it. They are not updated automatically if the visualization is updated.
JS embeds offer more browser support and more control over styling. If embedding on an angular app, for example, the app's CSS and JS can affect the embed. Users can also control the responsiveness of the embedded visualization.
The browser support aspect is only relevant when using old browsers. There shouldn't be any issues with modern browsers.
If modifying the CSS of visualization is not needed and/ or there aren't any strict requirements to support really old browsers, using the iFrame embed method should suffice.
Comments
Article is closed for comments.