This support article will explain some key concepts of using and publishing spatial data on Data & Insights, and link the various articles that cover the topic.
- Geospatial Datatypes and Formats on Data & Insights
- Importing Geospatial Datasets
- Geocoding Addresses
- How Spatial Lenses are Used and Changed
- Mapping
- Useful Transforms for Geospatial Data
Geospatial Datatypes and Formats on Data & Insights
The most commonly encountered geospatial data on Data & Insights is described by points - a pair of numbers that represent latitude and longitude. Here we are interested in three data types: point, polygon, and mutipolygon.
Point: a single point, representing a location. For example, according to Google Maps, the Seattle Public Library - Delridge Branch is at [47.553017916916914 -122.36325706938803]. In Data & Insights format, this would be POINT (-122.36325706938803 47.553017916916914). (Note in Data & Insights, the longitude is listed first, and there is a space between the numbers, but no comma.)
Polygon: a polygon is a collection of points that form a shape if one “connects the dots” on order of the listing. One closed polygon can br referred to as a boundary.
Multipolygon: Several boundary polygons can be strung together to form a multipolygon. A single polygon would be the outline of Colorado, for example. A multipolygon would be used to represent Hawaii, as each island would be its own closed polygon. Other common examples are maps of US states or US legislative districts.
Data & Insights can map points as POINT (-122.36325706938803 47.553017916916914). It can also map a set of points as a polygon (or boundary), and it can map a set of polygons as a multipolygon (or a set of boundaries).
Some datasets just define boundaries. Each row typically contains a multipolygon and then several text or numeric fields describing aspects of that multipolygon: various names, FIPS identifiers, area of land, area of water, etc.
More information on Geospatial datatypes can be found in Importing, Datatypes, and You.
Importing Geospatial Datasets
Geospatial datasets can be imported through the Data & Insights Dataset Management Experience, through ESRI connectors, through the ESRI Gateway plug in, with Socrata-Py, or even through FME.
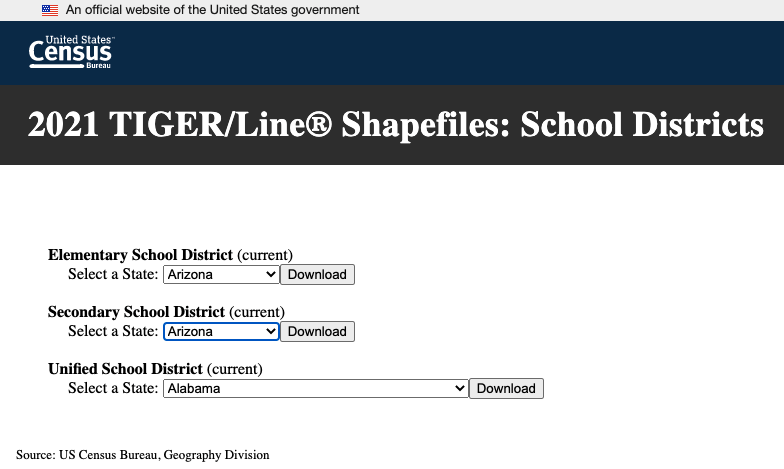
Shapefiles are a common format for uploading geospatial data. “Shapefiles” refers to a zipped folder of four or more files of specific types. Shapefile format is supported by ArcGIS or ESRI. Together, these zipped files describe the boundary dataset. To upload a set of shapefiles to Data & Insights using the DSMP, simply drag the whole zipped folder onto the user interface.
Many excellent shapefiles of boundaries are available at Tiger / Line, a site operated by the US Census. Below is an image of a selection for School Districts in Arizona.
Geocoding Addresses
Location (POINT) data can be uploaded through ESRI connectors or. gateway plug ins. It can also be uploaded by CSV in WKT (Well Known Text ) format as points or as just street addresses. Addresses in text format can be converted to point location data on import by Data & Insights' geocoding provider, Esri. Useful articles describing this process are:
Importing Geospatial Data with the Data & Insights Data Management Experience and
Creating Georeference Columns in the Data & Insights Data Management Experience
There are also several useful transforms here.
How Spatial Lenses are Used and Changed
Once a dataset containing boundaries (Multipolygons) has been uploaded, ensure that it is public. Public boundary files can be used to configure spatial lenses in a domain’s administration panel. The knowledge base article that outlines this process is Creating Spatial Lens Boundaries for Region Mapping.
A spatial lens is a static snapshot of a boundary dataset - not the dataset itself. Spatial lenses are used to aggregate point location data on maps, resulting in choropleth maps. Data & Insights has the ability to determine if a point location fits inside a multipolyon, and spatial lenses make good use of this ability.
When a map is created from a parent dataset that aggregates data using a spatial lens, a hidden column is added to the parent dataset that links the point in each row to the boundary in the spatial lens that contains it. A new hidden column is added for each map’s aggregation built on that dataset. For example - a dataset that had points aggregated to both US State and US legislative boundaries would have a column referencing each spatial lens.
Because spatial lenses are snapshots, they do not update when their source dataset is updated. A new spatial lens can be created from the updated file. Each map that relied on the old spatial lens will need to be edited to use the new spatial lens, if desired. Similarly, a spatial lens can be disabled without affecting any maps built on it. However, no new maps can be aggregated on a disabled spatial lens.
if you encounter difficulty creating a spatial lens, reference this article on Spatial Lens Boundary Limits.
Mapping
Mapping is covered in its own section: Maps.
Useful Transforms for Geospatial Data
There are several useful transformations involving spatial data, some of which solve problems, and some that provide new opportunities.
Correcting Projections
Sometimes a map will have its points or boundaries in the wrong areas, or missing completely. If everything else is correct, the problem could be that the data are in a projection other than wgs84. To fix this, refer to Data Transformations: Reprojecting from State Plane to WGS84.
Simplify Boundary Limits
If you encounter an error creating a spatial lens, refer to Spatial Lens Boundary Limits.
Transforms mentioned in Larger Articles
Handling addresses that are not geocodable
Converting X & Y value into a Point
Generating a Centroid Point within a County
Pulling Data from a Boundary File into Another Dataset
Socrata's ability to determine if a point lies within a boundary supports the region code transforms. These are best used on a new column in a dataset. Use these transforms to reference a column in another dataset containing multipolygons.
Data Transformations: Look Up Data from Geospatial Datasets with Region Code Functions
Comments
Article is closed for comments.