Choose Linear or Logarithmic Scale on Data Lens Distribution Chart X-Axis
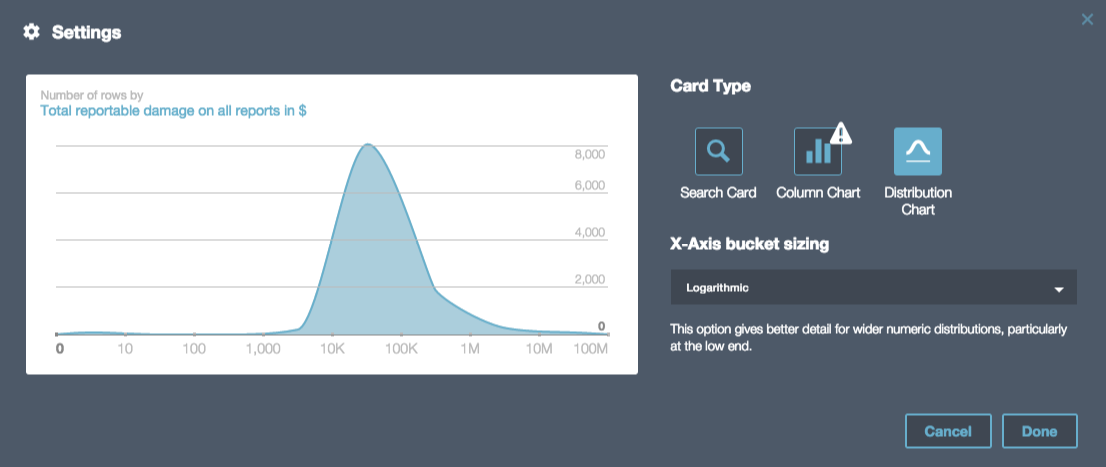
- Publishers can now choose between logarithmic scale or linear scale by updating the card settings for the Distribution Chart.
- This allows publishers to pick the scale that best fits their data and visually convey information.
- Linear scale is typically recommended for small number ranges and logarithmic scale is suited for wider number ranges. The system still automatically defaults to a scale based on the range of the numbers in the column.
Featured Dataset Thumbnail Deprecation
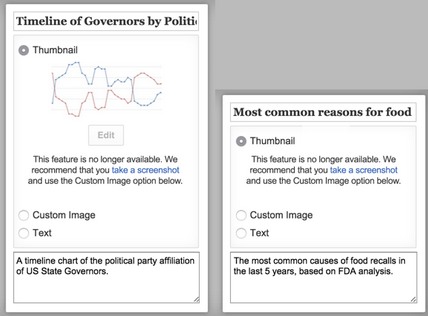
We have deprecated the ability to use a thumbnail image in favor of the custom image option when customizing images used for featured datasets.
- existing featured datasets that are using the thumbnail option will continue to work with no change
- when adding a new feature dataset or updating an image for a feature dataset, the thumbnail option will no longer be available
Selected Bug Fixes and Patches
- A better error message when Data Lens search suggestions are temporarily unavailable
- previously, when search suggestions are not available the error message that was displayed did not make it clear that search is still working.
- Preserve the capitalization through to the aggregation label in Data Lens
- previously when using the SUM aggregation by a column, e.g. ABC, the title of the chart read “SUM by the total of Abcs”. We have made the change to preserve the original capitalization.
Comments
Article is closed for comments.