Dynamic Status
Dynamic Status allows you to set a Measure's status based on a set of defined parameters. As the underlying data updates, so too will the Measure's status.
Proximity
Proximity status displays a status automatically based on a set numeric distance from a Measure's target.
Ideally, this status type would be best used in conjunction with Measures that are aiming to maintain an ideal, steady range of values (e.g. keep a steady ideal range of hours worked by paramedics over a 1 week period).
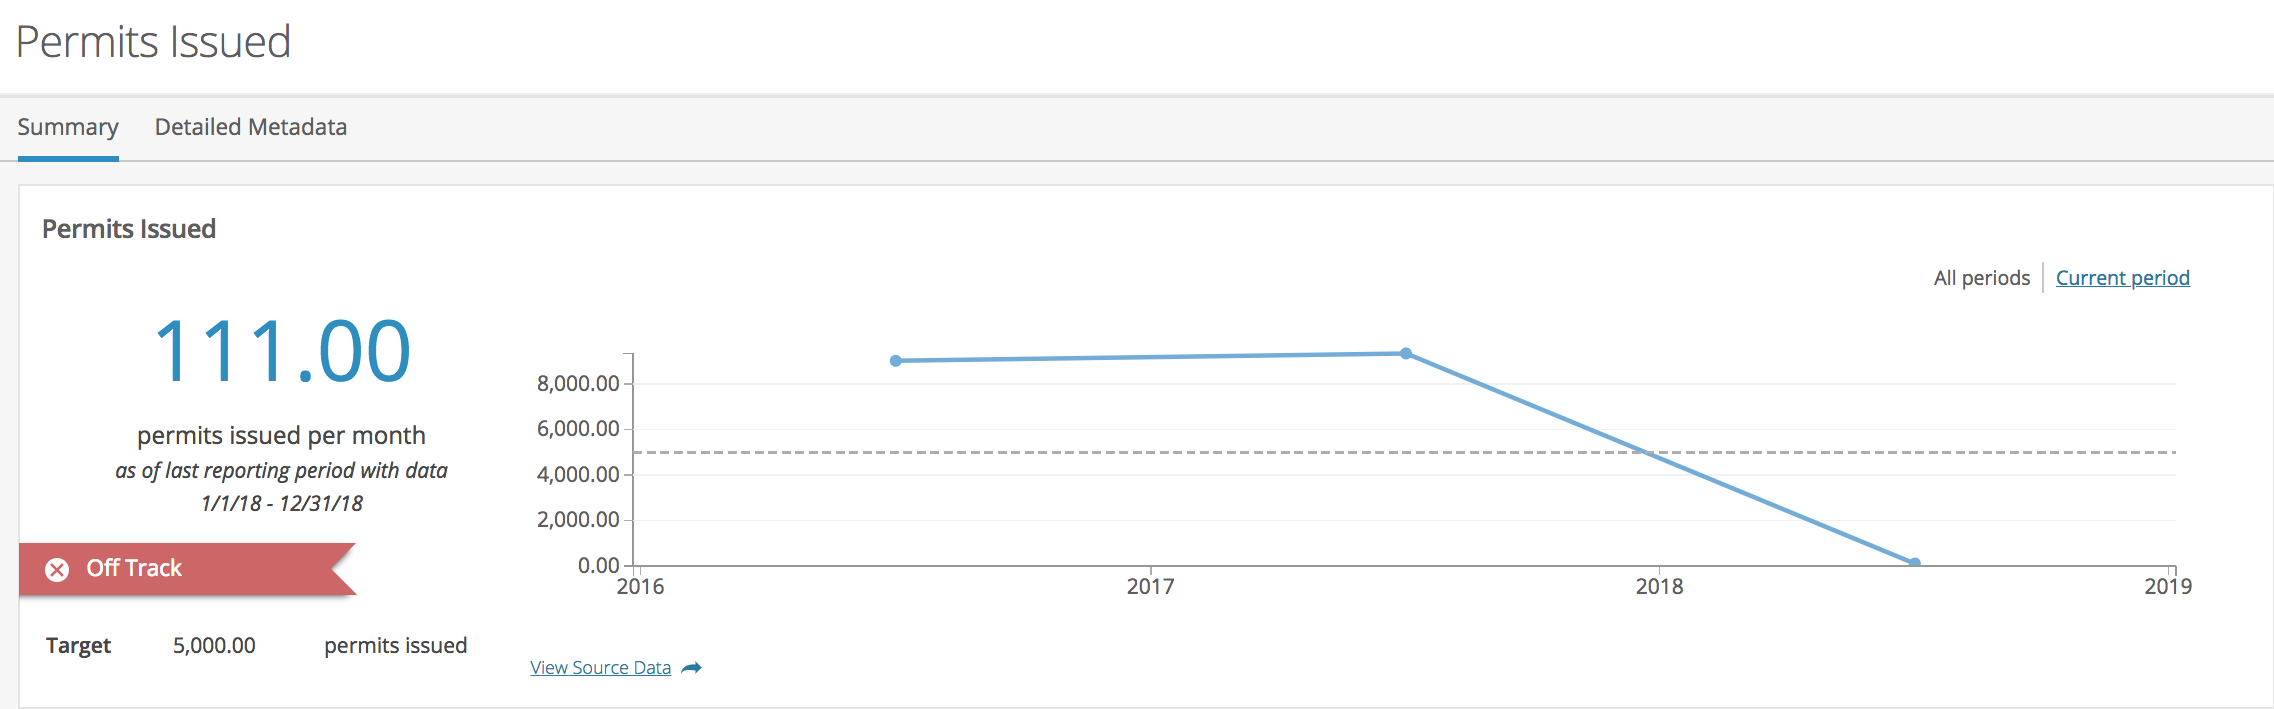
In the example below, this Measure tracks the number of building permits issued per month in the City of Evergreen, with a target of 5,000 permits. To know whether the City is on track, they've set up a status using Proximity.
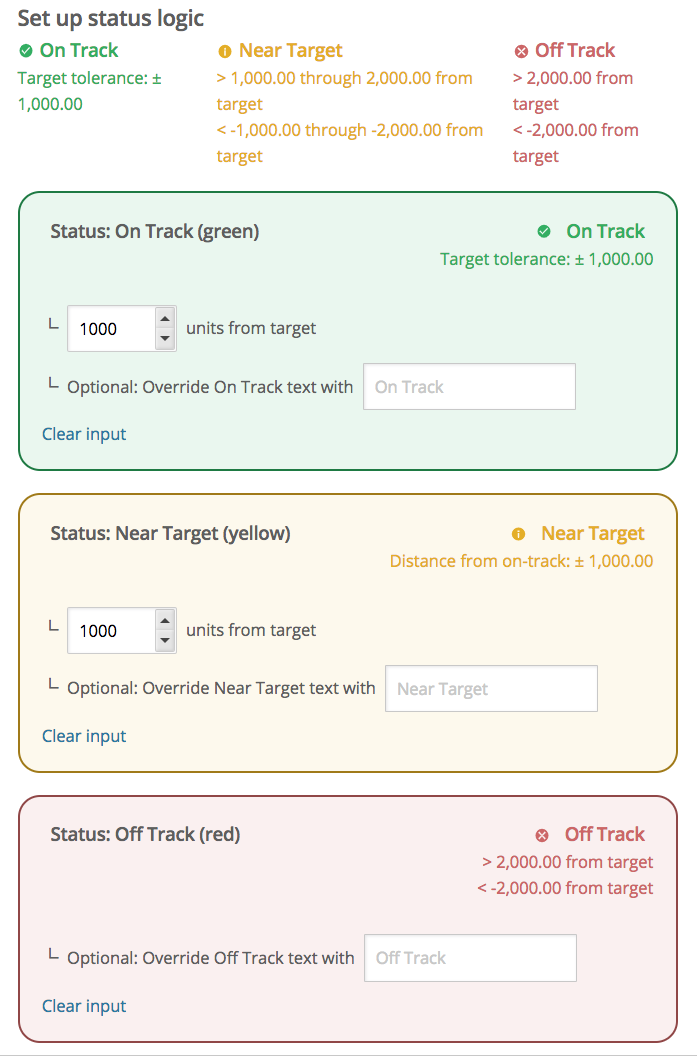
The status has been set up to alert stakeholders that if the number of permits varies +/- 2,000 permits per month, it will require further investigation. And sure enough, at the end of 2018, there was quite a decrease compared to earlier months.
Above / Below
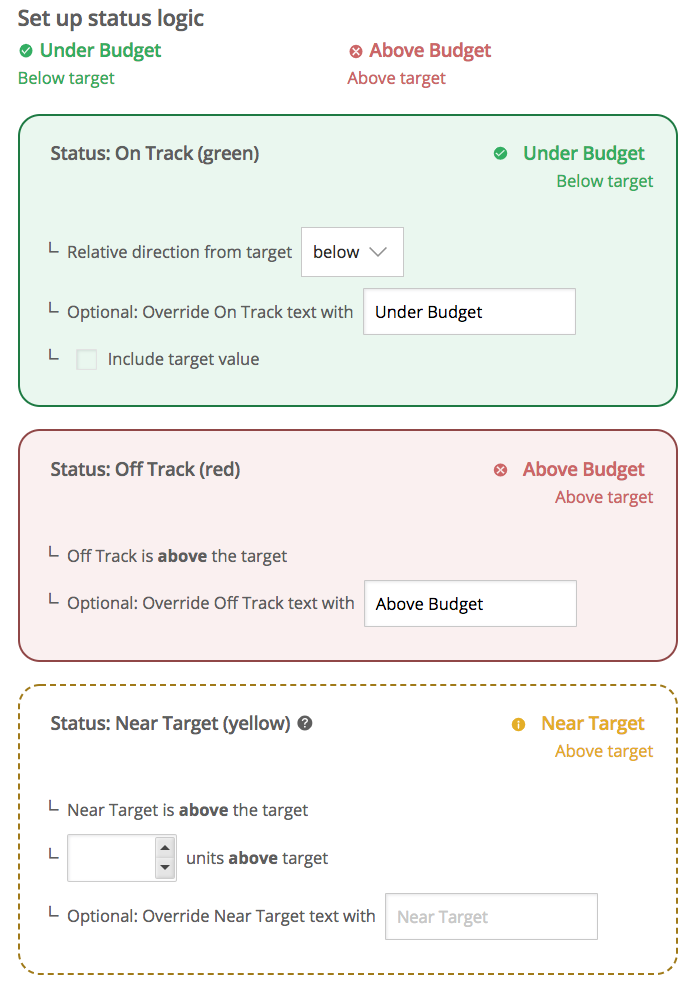
Above / Below status displays a status automatically based on whether a data point is above or below a Measure's target.
This status type is best used in conjunction with Measures that are tracking spending costs or even tracking a lowering or decreasing trend. One example of this might be to keep project spending below $200K with awareness of overspending at $180K, and sub-optimal spending at <$180K. Another example might be to keep the ideal enrollment for a job program above 1,000 individuals served each month with near-target enrollment in the range of 800-999 individuals and anything less than 800 as poor enrollment.
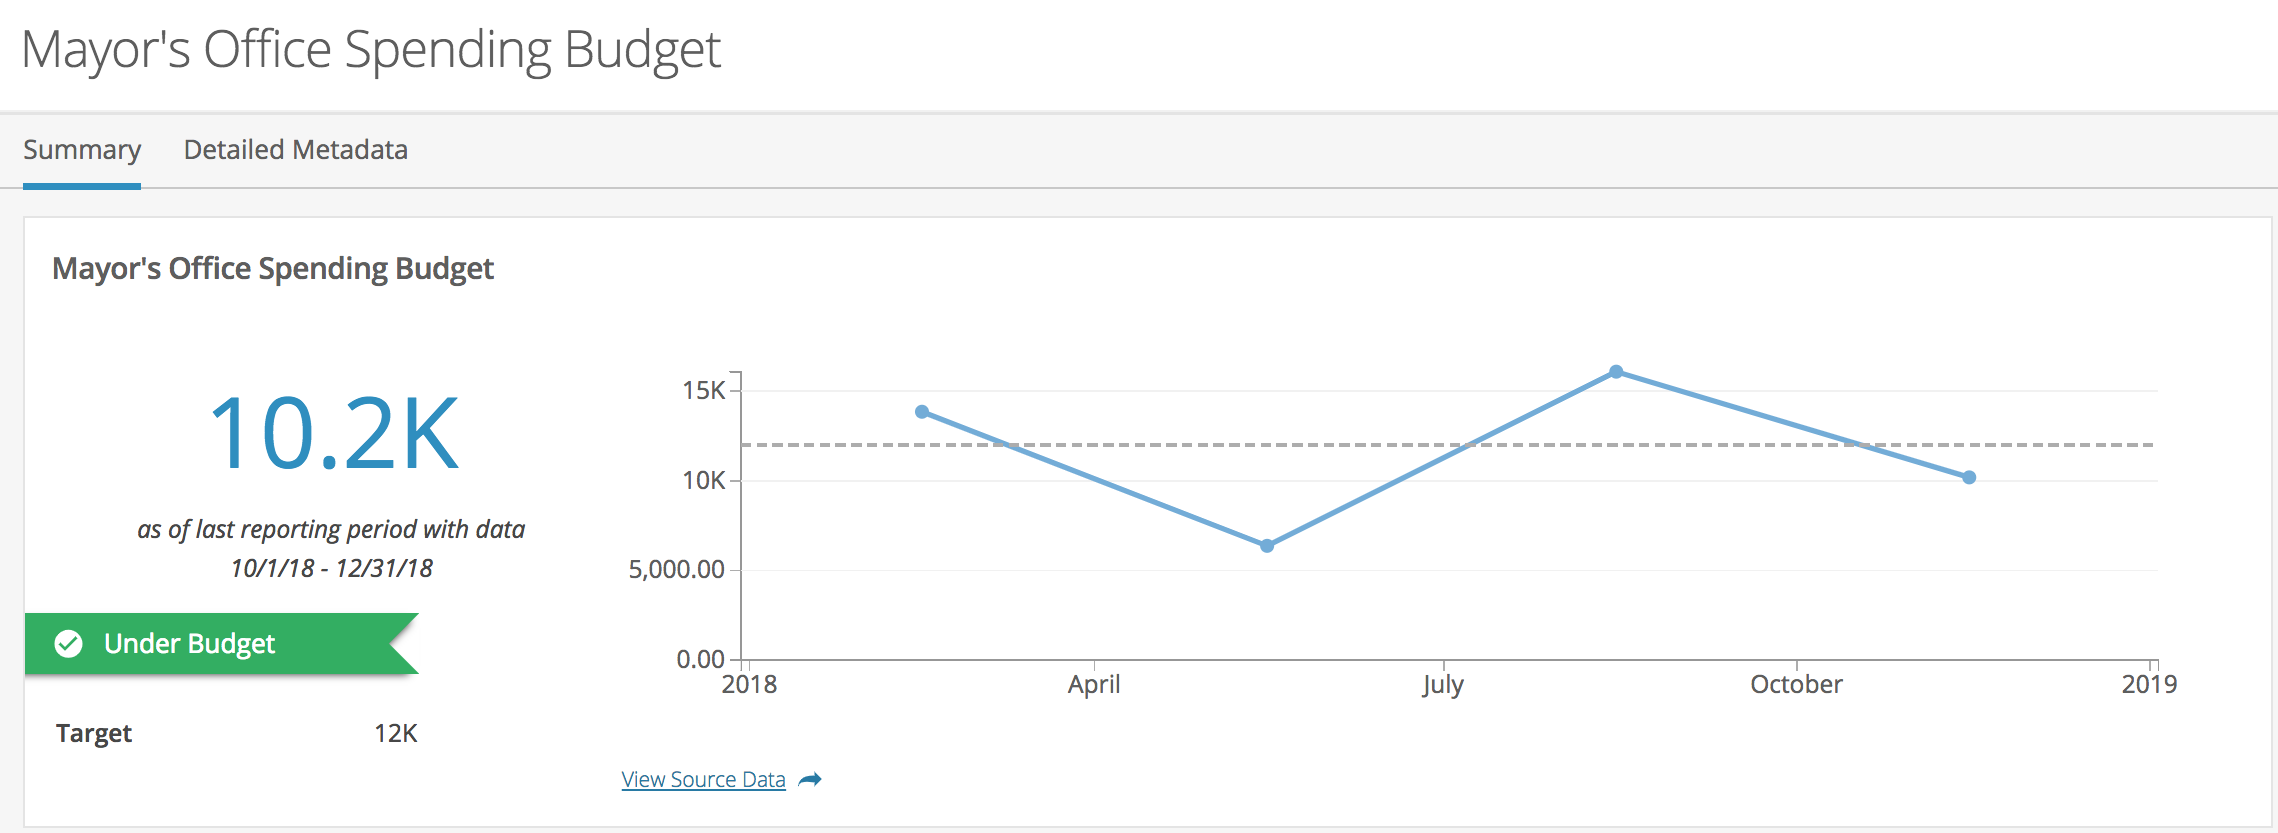
In the example below, this Measure tracks the spending within the Mayor's office, with a budget of $12,000. To stay on top of their spending, City officials have set up a status using Above/Below. Spending is tracked so that anything below $12,000 is within budget.
Looks like the Mayor's office is on track with their spending for this quarter!
Comments
Article is closed for comments.