Introduction
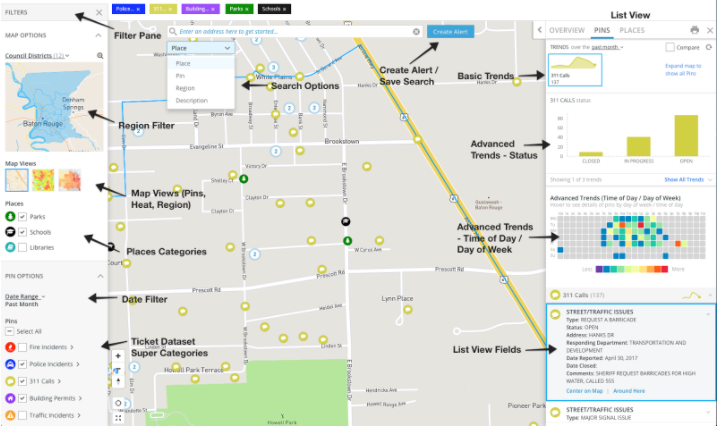
Citizen Connect allows you to visualize the key data about service delivery in your community in a simple, user-friendly interface, providing alerts and analysis for the public and internal users. The Citizen Connect interface is automatically generated from your data.
Citizen Connect is flexible to your organization’s specific data assets and needs. The table below shows the different data options that are supported by the Citizen Connect interface.
|
Site Component |
Dataset(s) Required to Enable Feature |
|
Trends & Filters |
|
|
Places |
|
|
Mini-map and regional breakdown |
(NOTE: For your Citizen Connect to work, each dataset must be organized into a flat-file. You can think of this as having all your data on a single tab in Microsoft Excel. This document will explain each of these datasets in detail.)
Tickets Dataset
Tickets are events which include 1) date/time, and 2) geolocation (latitude and longitude). The Tickets datasets contain all the descriptive information about the incidents you are sharing through Citizen Connect. The values in this dataset populate the module’s filters, trends, and list view details.
The screenshot below shows the data schema for a tickets dataset.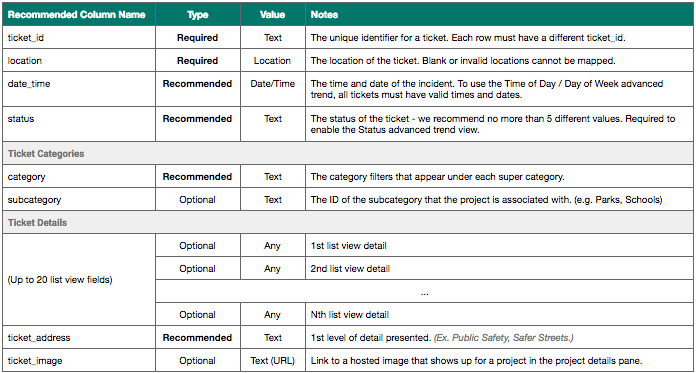
Places Dataset
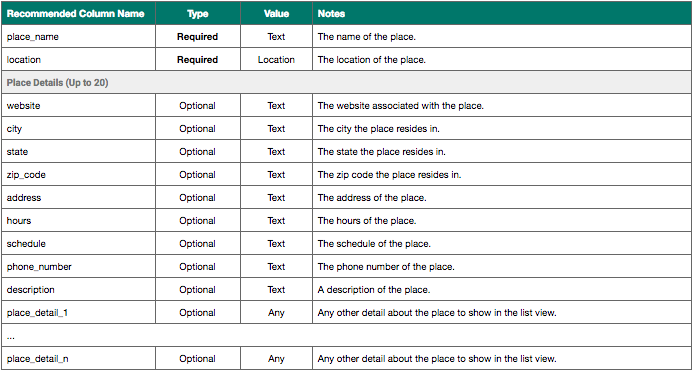
Places are static items shown on a map to help provide the user context about a location. Common examples of places are schools, parks, hospitals, libraries, and much more
The screenshot below shows the data schema for a places dataset.
Shapes Dataset
Shapes, also called Shapefiles, are a collection of polygons to create boundaries on a map that help users make sense of data. Common examples include 1) census tracts, 2) neighborhoods, 3) regions, 4) council districts, and many more
Citizen Connect allows data to be filtered by region or district and offers a clickable map of those districts for easier navigation.
Below is an example of a shapes dataset schema:
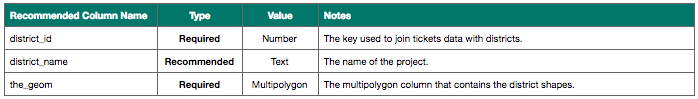
(NOTE: Citizen Connect expects the shapes for incidents to be in a separate dataset than the details of those incidents)
Field Mapping
The fields on the datasets will be mapped as shown below:
Comments
Article is closed for comments.